I just listened to Bill Simmons’ new podcast “Bill Don’t Lie” and it’s very good. They are obviously taking a more advanced stats approach on topics which should have r/NBA salivating. Their analysis is great but they of course do some pretty serious speculating, it’s still Bill’s show.
During the show they suggested that the league is taking more 3’s. This is very true. Last year (14’) there were over 10k more 3’s taken than in 05’ total. But they also wanted to know how many more 3’s the top 20 shooters in the league were taking, with the assumption that they were taking way more at a much lower percentage. This is not true. I’ve been following it so ran the numbers to see exactly what this looked like.
Data is based on the top 20 shooters by total 3’s made- pulled from NBA.com/stats by year. This is all OC. Use Google sheets and Kimonolabs to analyze.
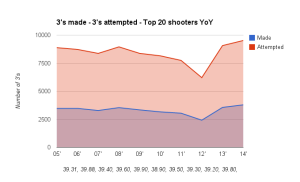
While total 3's made and attempted in the last two years has increased. The top 20 shooters have pretty much taken and made a similar number of 3’s Year-over-Year. The big difference is that Curry has pushed the curve up in the last two years. This year will be higher because of him/Clay/Korver are all pushing the curve up. The top 20 cumulattive percentage made has pretty much stayed flat. In fact this year is the best it’s been since 09-10’.
Year-over-Year 3’s made - Top 20 players
| Year | Made | Attempt | Percentage Made |
| 05' | 3465 | 8880 | 39.02% |
| 06' | 3469 | 8724 | 39.76% |
| 07' | 3280 | 8370 | 39.19% |
| 08' | 3536 | 8952 | 39.50% |
| 09' | 3337 | 8372 | 39.86% |
| 10' | 3158 | 8153 | 38.73% |
| 11' | 3041 | 7745 | 39.26% |
| 12' | 2419 | 6210 | 38.95% |
| 13' | 3557 | 9066 | 39.23% |
| 14' | 3785 | 9518 | 39.77% |
Interactive Version of this Graph
To me what's most interesting is that this trend is just starting. The lockout in 11-12’ season disrupted the trend but since that season teams have been letting their best shooters loose and it’s paying off. I expect we are at the very start of this and next year as more teams pace and space this chart will continue a steep up and to the right line.
More data and graphs on all of this here. https://docs.google.com/spreadsheets/d/13PUkfSpGfCUYBPifmfUpKISI1iHqxBWe1Pco2LZkCtc/edit#gid=754019401
Please comment on reddit or Email mandrews33 at gmail.com with feedback/questions.